•All data points are logged to the non-volatile memory of the device so that they are still available after reboot. •Maximum value of Number of Samples to Record reduced from 10,000,000 to 1,000,000 •Maximum number of value points visible for each variable when showing the 2D Graph set to 699050 (see graph description below for details) •Introduced a maximum "Number of Samples to Record" for all graphs in a project (number is device dependent) •Each variable can be logged either time based or at every value change (see Log Trigger) •Possible to configure if data shall be logged in low power mode or not with new property Log Data in Low-Power Mode •Introduced new variable reference for showing the progress of copying the graph's history. See Copy Progress Variable and Process 2D Graph Data on a PC •Introduced two new JavaScript functions to save (copy) or delete the graph's value history (save2DGraphHistory, delete2DGraphHistory) |
The graph object is designed to show the value history of one or more variables in a line graph.
For each variable that shall be displayed in the graph it can be configured if logging of a value shall happen for every value change or time based (see Log Trigger).
Each logged data point consists of a time stamp and the value at that time stamp. All entries are saved to the non-volatile memory of the device in a ring buffer so that the value history is still available after shutting down and re-booting the device. Logging is active even if the 2D graph object is not visible on the screen.
WARNING:If power is completely removed from the device without properly shutting it down using the ignition, it is possible that the last 1% of data in the ring buffer gets lost! Always power down the device using the ignition and the integrated power management!
To save RAM on the device only the data points that are currently shown on the screen are loaded from the hard drive. This means that one can experience slight delays when changing the currently visible time span or the offset because the data needs to be loaded from disk.
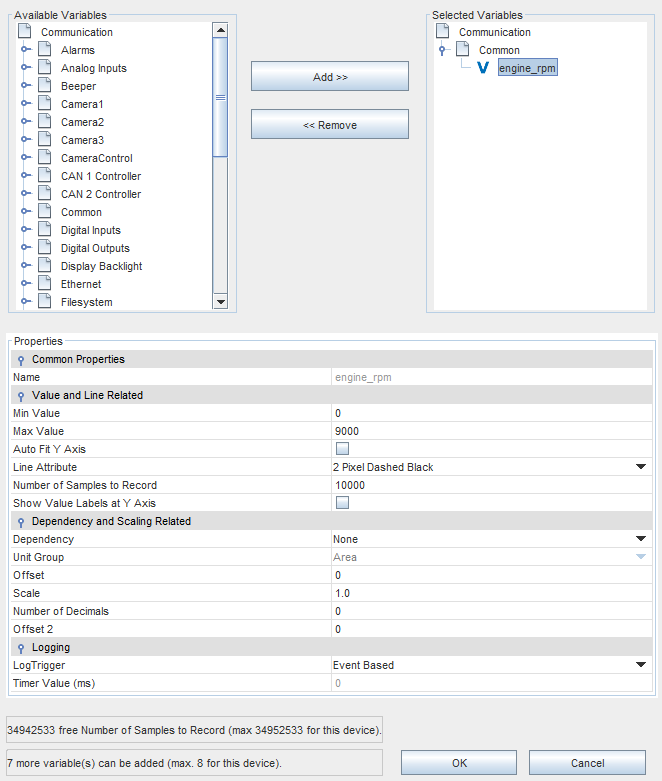
To make sure that the non-volatile memory of the device does not get filled up with graph history data, the number of data points that are logged for all graphs in a project is limited (device dependent: on devices with i.MX6 CPU: 34952533 samples (about 400MB on the non-volatile memory), on devices with i.MX35 CPU: 8947848 (about 100MB on the non-volatile memory) ).
Drawing the graph's value lines can be very CPU heavy. The value lines are a polygon that consists of many points. To improve drawing performance, this polygon will be simplyfied if it consists of too many points (current threshold: ~1000 samples). While this improves the drawing performance it may reduce the accuracy of the drawn polygon but may keep the display still usable if too many samples shall be drawn.
The logged history of each graph can be copied from the device and then be converted to a CSV file that in turn can be processed by a spreadsheet application. See here for instructions.
The complete value history can be reset (deleted) with the JavaScript delete2DGraphHistory function.
Displaying the logged data at run time needs some CPU time. To improve performance of the 2D Graph, the object is not redrawn at each variable change but automatically redraws itself with the latest values in a fixed interval (currently about every second). If there are still performance issues the following measures can improve it:
•Reduce the numbers of shown variables in the graph
•Reduce the number of samples for each variable in the graph (see Number of Samples to Record )
•Scale the X axis so that less data points are visible at once
•Consider changing the Log Trigger for each variable to Time Based with an appropriate timer value.
•If all of the above is not feasable for you application, think about upgrading to a newer device generation with more CPU power
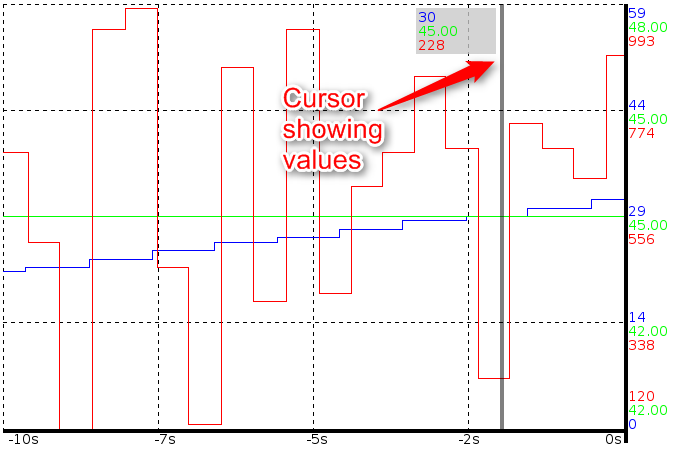
Each variable can either be attached via the dialog that pops up when the ... button is pressed in the property table for property "Variables To Draw" or by dragging a variable from the Variable View onto the graph in the designer area. X Axis Time VariableWith a variable attached to this property the time span of the X axis can be scaled. If no variable is attached, the default time span is 10 seconds. At run time the scaling is done every time the variable value is changed. The value of the variable represents the time span of the X axis in seconds. Variable values less than 1 are not considered. Default value: None Possible values: Any integer variable X Axis Offset VariableWhen a variable is attached to this property, it is possible to move in the history of the graph. For each increment of the variable, the graph will move one second into it's history and shows "old" values. Values less than 0 are not considered. If the value 0 is set, the graph shows "live updates" of the values. Default value: None Possible values: Any integer variable Cursor Position VariableIt is possible to move a cursor line in the graph. With this cursor line it is possible show the values of each variable at the time where the cursor is. The cursor position represents the distance in pixel from the right side of the 2D Graph. When a variable is attached to this property the cursor can be activated by setting a value greater or equal to 0 (0 shows the latest values).
Default value: None Possible values: Any integer variable Copy Progress VariableIf an integer variable is atached, it will show the copy progress when copying the graph's history data. See save2DGraphHistory and here for details. Default value: As configured for the varaible Possible values: 0 .. 100 while copy is in progress or -1 on error. |
The recorded log data can be copied to a PC and then be processed by a tool to make it readable by e.g. a spreadsheet application. Use the JavaScript function save2DGraphHistory to store the data on a USB drive. Example JavaScript: //Get path of mounted USB drive: var usbMountPath = getVariableValue("@USBMountPath"); //Save history to target path. The 2D Graph has object ID 42 var result = save2DGraphHistory(42, usbMountPath); if (true == result) { print("Copy 2D Graph history started"); } else { print("Starting copy 2D Graph history FAILED"); } Note that the copy progress can be observed via the Copy Progress Variable. When saving the history, a new directory is created on the USB drive with the following name: graph_hsitory_NAME_OF_2D_GRAPH On the PCAfter transfer is done, the data can be viewed and processed with the Graph History Tool. Follow these basic steps to export the data into a CSV file that can be opened by a spreadsheet application: •Press the browse button and select the graph history directory on the USB drive. •After the directory was selected, the data of each variable can be viewed in a table. •Press the Export button to select export options and then press OK to export the data into one or more CSV files. A detailed manual for the Graph History Tool can be viewed here. Manual data processingThe data can also be processed by you own applications. The storage format is: •64Bit timestamp in milliseconds since 01-01-1970 •32Bit integer value All values in Little Endian format. The ring buffer is implemented as 100 files per variable. Each file is named with the name of the variable and a sequence number. |

